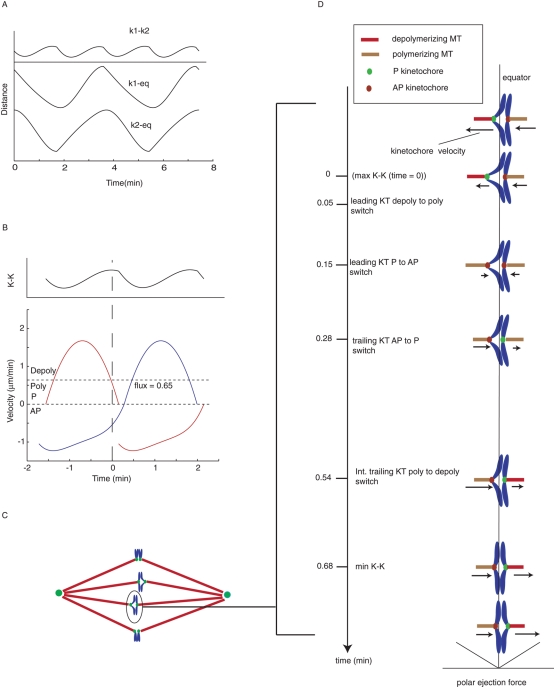
FIGURE 6:
Kinetic features of sister kinetochore directional instability that double the frequency of K-K centromere oscillations compared with the frequency of oscillation of sister kinetochores and the center of the centromere in metaphase PtK1 cells. (A) Reconstruction of sister kinetochore oscillation relative to the equator and K-K oscillation based on the velocities in B. (B) Reconstructions of P and AP velocities for a pair of sister kinetochores (in blue and red). AP end velocity and P start and end velocities were constrained to zero for average kinetic profiles of P and AP movement (dotted lines in Figure 4). Only AP start velocity was not constrained. Average times for maximum and minimum K-K centromere stretch were obtained from Table 2. (C) Diagram of metaphase PtK1 cells. (D) Diagrammatic representation of half cycle of K-K centromere stretch for an oscillating chromosome, such as the one circled in (C). The half cycle begins before maximum stretch (time set equal to zero on the left-hand vertical axis) and ends just after minimum stretch. Initially, the left sister kinetochore is in depolymerization phase moving P and is the leading kinetochore pulling the sister pair across the equator (vertical line) and into the left half-spindle. The right sister kinetochore is the trailing kinetochore in polymerization phase and moving AP. The average times of switching between depolymerization/polymerization phases and P/AP movements are given on the left time axis as measured in Table 2. The average magnitudes of P and AP velocities as a function of time are indicated by the length of the arrows next to each kinetochore. Net polar ejection force, which increases with distance from the equator (assumed linear here), is shown at the bottom. See the text for more details.

