FIGURE 8:
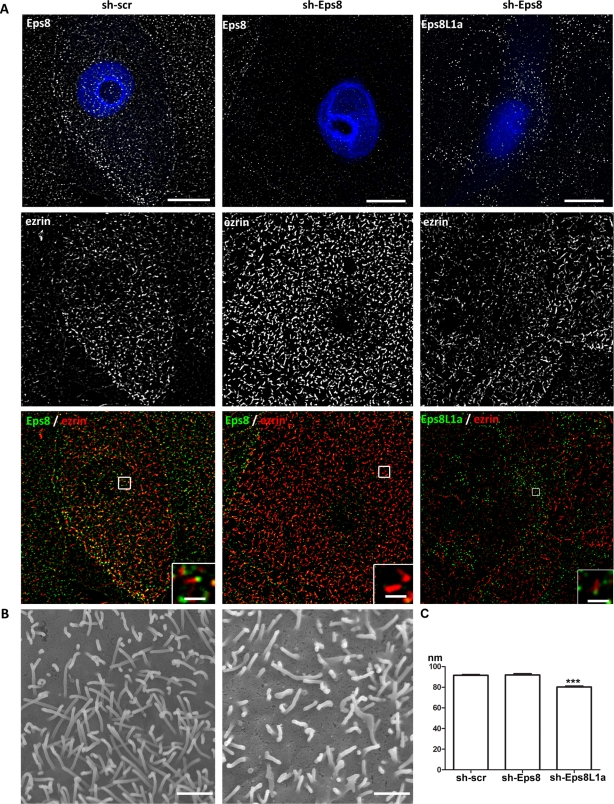
LLC-PK1 cells depleted for Eps8 display irregular microvilli at their apical surface. (A) Immunofluorescence and (B) CL-SEM were performed on cells expressing shRNA scr (left) or targeting Eps8 (middle and right). Transfected cells were detected through the expression of GFP (artificially rendered in blue). Eps8L1a localizes to the tip of the microvilli (right). Bars, 10 μm; inset, 1 μm. (B) CL-SEM indicates that cells depleted for Eps8 display shorter and more irregular microvilli. Bar, 1 μm. (C) Graph showing the width of the microvilli determined from CL-SEM images of cells transfected with Scr, Eps8, or Eps8L1a psiRNA. The values in the histogram are means ± SE. Statistical significance was determined by one-way analysis of variance with a Dunnett multiple comparison test. The width (nm) of the microvilli in cells depleted of Eps8L1a is significantly thinner than in cells transfected with nontargeting or Eps8-targeting shRNA, with p < 0.005.

