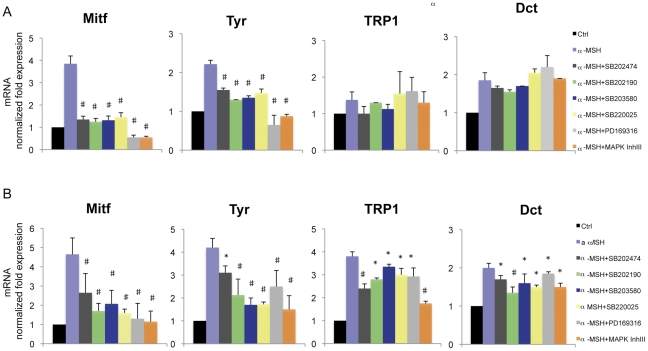
Figure 2. The effect of pyridinyl imidazoles on melanogenic gene expression.
(A) Semi-qunatitative real-time PCR was used to measure Mitf, tyrosinase, TRP1 and TRP2 mRNAs expression in B16-F0 cells after 6 h and (B) 24 h of tratments. The graphs show fold differences in transcript abundance in untreated cells, and α-MSH-treated cells (0.1 µM) in presence or not of PI compounds (SB202474, SB202190, SB203580, SB220025, PD169316 20 µM: MAPK Inh III 10 µM). The results shown in (A) and (B) were normalized by the β-actin mRNA levels. The data show the mean±SD of four experiments performed in triplicate. *P≤0.05; #P≤0.01 versus control.

