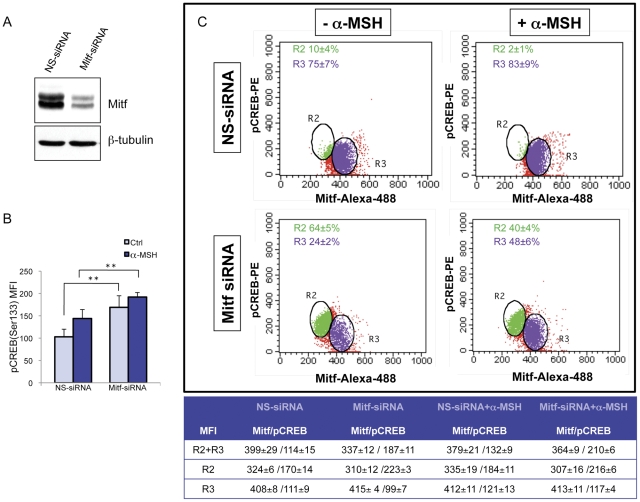
Figure 4. Coordinated regulation of Mitf expression and CREB activation.
(A) One representative western blot anti-Mitf used to quantify RNA interference efficiency after 24 h of nucleofection. (B) Analysis of Mitf siRNA interference on CREB level of phosphorylation was analyzed measuring CREB level of phosphorylation by measuring PE-CREB-Ser133 median fluorescence intensity (MFI) in duplicates. Histogram represents means±SD of MFI of three independent experimets. (C) Dot plot analysis of one representative experiments of Mitf-siRNA showing higher MFI of PE-CREB-Ser133 in samples presenting low levels of Mitf expression (region R2) in comparison with the cell fraction presenting high levels of Mitf (region R3).

