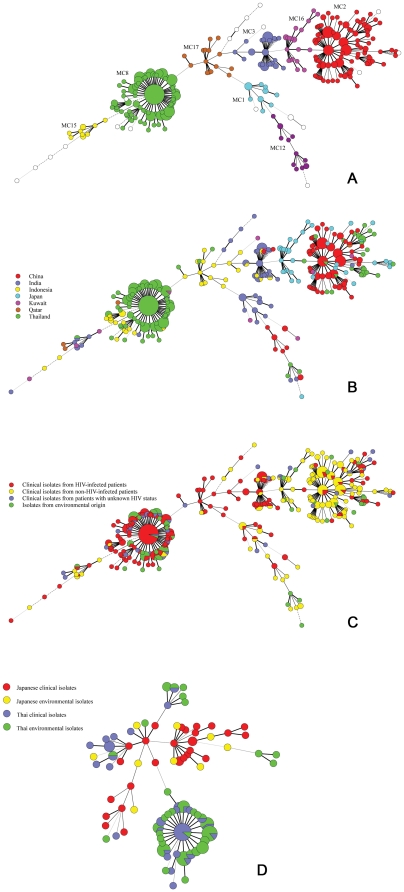
Figure 1. Genotypic variation of C. neoformans isolates from different Asian countries by microsatellite typing.
(A) Minimum spanning tree based on a multistate categorical analysis representing 429 C. neoformans var. grubii isolates from different countries. Each circle represents a unique genotype. The size of the circle corresponds to the number of isolates within that genotype. Numbers and connecting lines correspond to the number of different markers between genotypes. Genotypes with identical colors are part of a microsatellite complex (MC). Circles without color are unique genotypes that are not part of a MC.; (B) Same as A, but now showing the genotypes from different geographic locations. Different colors correspond to different countries.; (C) Same as A and B, but now showing the genotypes from clinical and environmental sources.; (D) Same as A, B and C, but now showing the genotypes of Thai and Japanese population from clinical and environmental sources.

