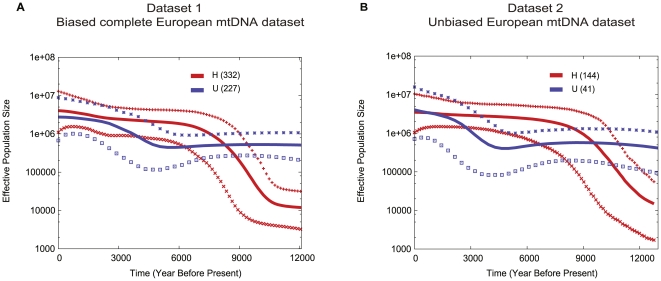
Figure 3. Estimated effective population size (Ne) of type H (red) and type U mtDNA haplotypes (blue) for the complete European mtDNA dataset as well as for the sampled dataset.
The x-axis shows time in years before present, the y axis the effective population size Ne. The center line represents the mean of Ne estimate, upper and lower lines are the 95% posterior density intervals. We assumed a mutation rate of the coding regions of 1.691×10⁻⁸ substitutions per site and year [30]–[32].

