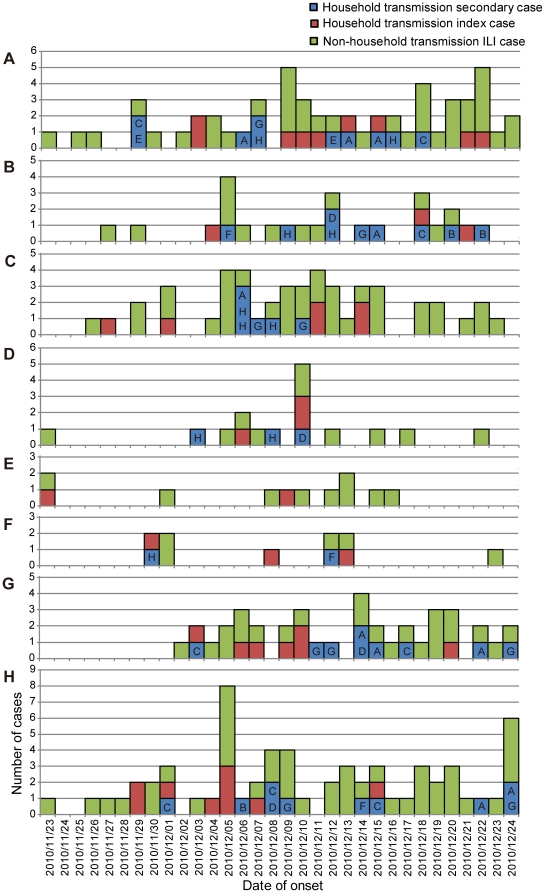
Figure 6. Epidemic curves for each affiliation.
Epidemic curves of household transmission index cases, household transmission secondary cases, and non-household transmission ILI cases in (A) school A, (B) school B, (C) preschool C, (D) preschool D, (E) preschool E, (F) preschool F, (G) children at home, and (H) adults. The letters attributed to the household transmission secondary cases are the affiliations of their index cases; A, school A; B, school B; C, preschool C; D, preschool D; E, preschool E; F, preschool F; G, children at home; H, adults.

