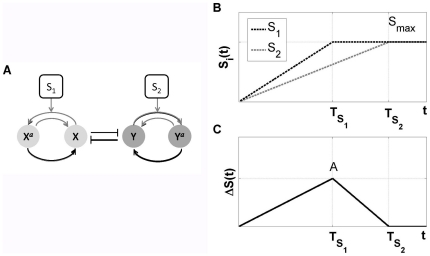
Figure 1. Paradigmatic integrated signaling–transcriptional circuit switch.
(A) Schematic representation: Nodes represent proteins, regulated by protein kinases with concentrations  and
and  , where
  and
and  stand for transcription factors that can be phosporylated to generate
  and
and  . Black lines represent transcriptional interactions, while grey lines stand for protein-protein interactions. (B) Time evolution of the input signals
  (black) and
  (grey), with
  . In this work
  is considered to have a rising time
  smaller than
  . (C) Amplitude of the transient asymmetry between signals
  . Here the maximal asymmetry is
  (see also Table 1 and Methods).

