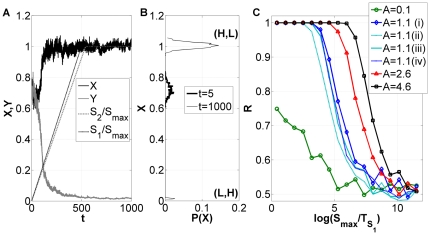
Figure 3. Asymmetric decision under fluctuations.
(A) Typical time series of  and
and  for two input signals that grow at different speeds. (B) Initial and final distribution functions of
  values for 1000 cells. (C) Dependence of the fraction
  of cells that end up in the high branch, on the speed of the transition (measured by
  ) for different values of the maximum asymmetry
  (see Fig. 1C). For all curves in (A), (B) and (C) with exception of plot
  (ii), (iii) and (iv), the underlying equations are Eqs. (1) to (4) with
  . Also shown in (C) for
  are the ratios
  for an extended version of the system of Eqs. (1) to (4) with noisy
  dynamics (dashed dark blue line, no symbols (iv)) and without noise (solid light blue line, no symbols (iii)) (see also Eqs. (6) to (9) in Methods). We also tested the effects of fluctuations in phosphorylation reactions, i.e.
  (see (C), dashed light blue line, no symbols
  (ii)) for the extended system of equations (Eqs. (6) to (9)) with noisy
  dynamics. Parameters for (A), (B) and (C)
  (i) are those of Fig. 1 and
  for all curves (see also Table 1 and Methods). Parameters for (C)
  (ii), (iii) and (iv) are
  and
and  (see also Eqs. (6) to (9)). For all curves
  and where fluctuations are considered
  .
.

