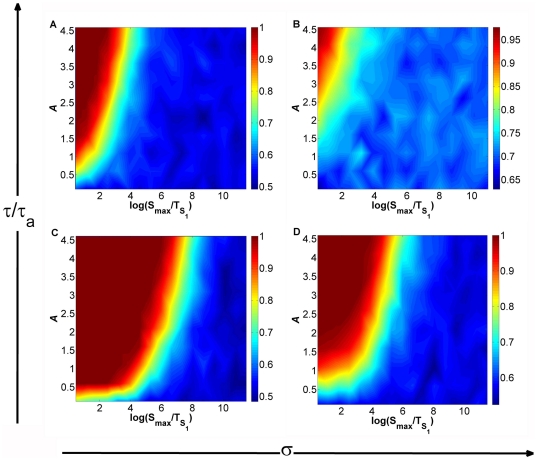
Figure 4. Effect of time scale differences and noise on SdCDM.
The decision bias, measured by the fraction  of cells that end up in the high branch, is plotted in color scale versus the transient asymmetry parameter
  and the signaling speed (controlled by
  ), for several noise and time scale ratios. (A)
  and
and  . (B)
. (B)  and
and  . (C)
. (C)  and
and  . (D)
. (D)  and
and  . Blue denotes a symmetric decision, and red an asymmetric decision, which appears for slow enough speeds if the transient asymmetry is non-zero. Parameters are those of Fig. 1, plus
  (see also Table 1 and Methods). The underlying equations are Eqs. (1) to (4) with
  .
.

