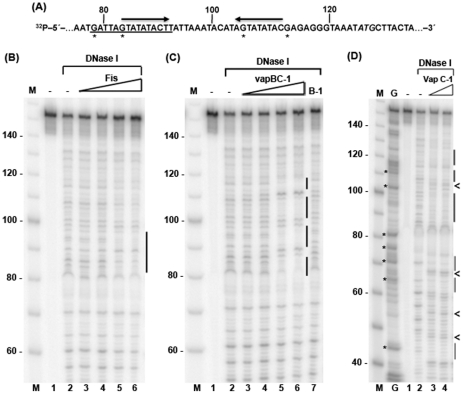
Figure 3. DNase I protection of the vapBC-1 locus control region by Fis and Vap proteins.
(A) The 32P-labeled sense strand of 153 bp DNA substrate containing vapB-1 TIR and upstream sequence in the vapBC-1 locus control region, is shown with numbers indicating the distance from the 5′-labeled end. The putative Fis site (underline), inverted repeat regions (arrows), vapB-1 translation start ATG (italics), and G cleavage products (*) seen in (D, lane G) are noted. On each gel shown, a 10 bp DNA ladder (lane M), 153 bp substrate without protein (lane 1), and DNase I digest of the substrate (lane 2) are indicated. Gels show DNase I cleavage products from samples containing: (B) a Fis∶DNA molar ratio of 2∶1, 7.5∶1, 15∶1, or 30∶1 (lanes 3–6), (C) a VapBC-1∶DNA molar ratio of 2∶1, 7.5∶1, 15∶1, or 30∶1 (lanes 3–6) or 40∶1 VapB-1∶DNA (lane 7), and (D) VapC-1∶DNA molar ratio of 40∶1 or 80∶1 (lanes 3 and 4). Vertical bars indicate the DNase I footprint from protein binding. Arrows (<) in panel D indicate DNase I hypersensitive sites. The gels each represent one of two independent experiments.

