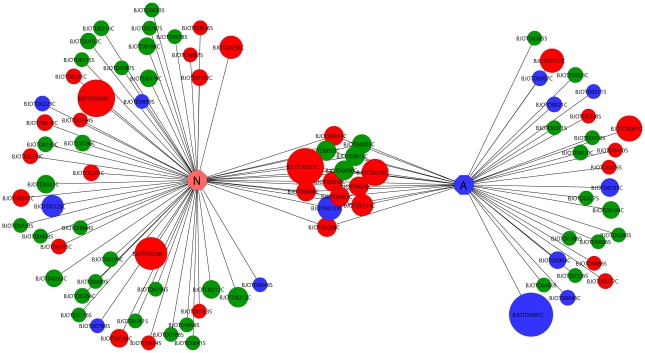
Figure 2. Graphical overview of SVMP clusters from newborn and adult venom gland cDNA libraries.
Newborn (N) exclusive clusters are shown on the left, shared clusters in the middle and adult (A) exclusive clusters on the right. P-III class SVMPs are shown in red; P-II class SVMPs are shown in blue and SVMP clusters whose sequence matched only to UTR regions, signal peptide, pro-domain and/or catalytic domain are shown in green. The area of each circle is proportional to the number of clones comprised in that cluster. Circles are labeled as either cluster (C) or singleton (S). Graphical view generated with Cytoscape v. 2.8.1 [39].

