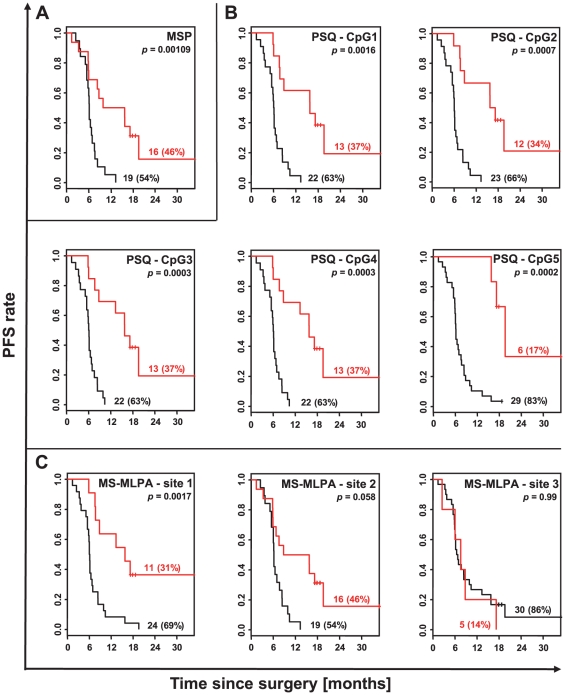
Figure 2. Method-dependent Kaplan-Meier estimates of PFS.
PFS data for binary methylation covariates were obtained from (A) MSP, (B) PSQ CpG sites 1 to 5 and (C) MS-MLPA sites 1 to 3 based on missing data imputation (n = 35) for each diagnostic method applied. Respective cut-points allowing the conversion from continuous to binary methylation data in (B) and (C) are indicated in Table 2. Of note, Kaplan-Meier curves for MS-MLPA sites 2 and 3 were computed on grounds of insignificant cut-points (see Table 2). Respective p values of the maximally selected log-rank test and respective numbers (percentages) of tumours assigned to each group, methylated or unmethylated, are given in each plot. Black curves, unmethylated; red curves, methylated.

