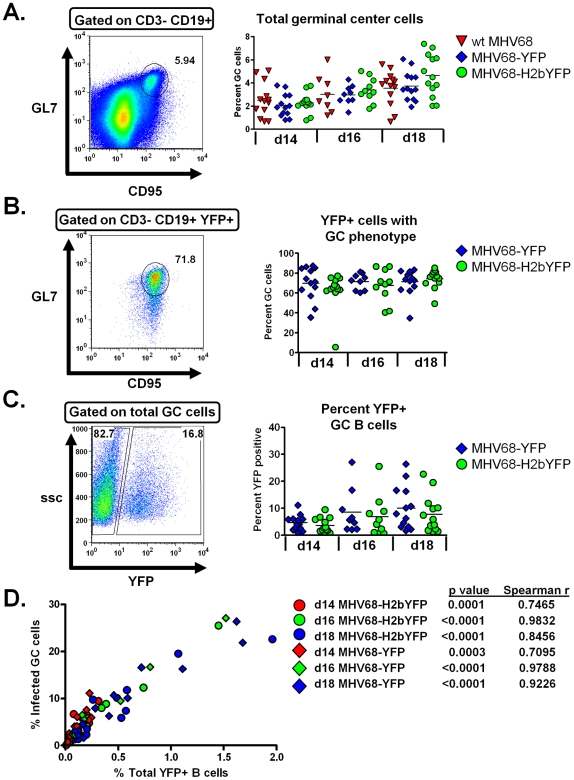
Figure 3. Expression of H2bYFP does not alter germinal center dynamics of MHV68-H2bYFP.
Mice were infected with 1,000 pfu of the indicated virus and spleens were harvested at the indicated day post-infection. A) Total germinal center B cell analysis. A representative flow plot showing the gating strategy to identify total germinal center population is shown in the left panel. B cells were defined as CD19+ CD95HI GL7HI. Quantitation of the percentage of B cells with a germinal center phenotype is shown in the right panel. B) Percentage of EYFP and h2bYFP positive cells that have a germinal center phenotype. Representative flow plot showing the gating strategy used to identify cells with a germinal center phenotype in the EYFP and h2bYFP positive fraction is shown in the left panel. The percentage of EYFP and H2bYFP positive cells that have a germinal center phenotype is shown in the right panel. C) Percentage of germinal center cells that are infected. A representative flow plot showing the gating strategy to identify the percentage germinal center cells that are infected based on YFP expression (left panel). The percentage of germinal center cells that were infected is shown in the right panel. D) Correlation between the percentage of EYFP and H2bYFP positive B cells and the percentage of EYFP and H2bYFP positive germinal center cells. In the right panels of A, B and C, the horizontal bar represents the mean.

