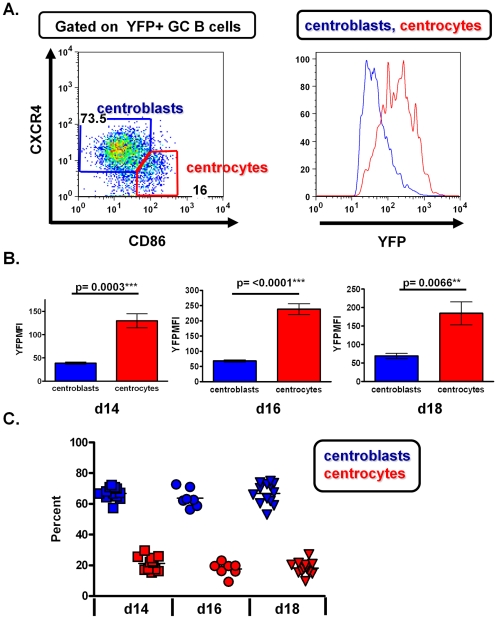
Figure 6. Characterization of infected centroblast and centrocyte populations.
A) Gating strategy used to identify YFP positive centroblasts and centrocytes (left panel). Representative histogram showing YFP expression in centroblasts and centrocyts (right panel). B) Mean fluorescence intensities of YFP in centroblasts and centrocytes at days 14, 16 and 18 post-infection. Each graph shows one representative experiment with 4 to 5 mice per group. H2bYFP MFI was analyzed in at least 3 independent experiments at each time point with similar results. C) Quantitation of H2bYFP positive centroblast and centrocyte populations at the indicated days post-infection.

