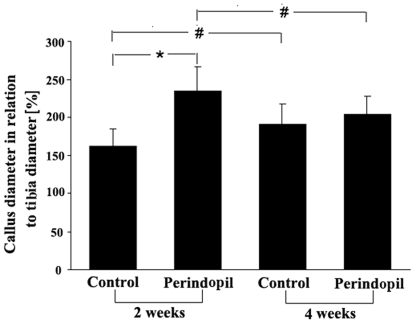
Figure 1. Radiological analysis of callus diameter in relation to the diameter of the tibia at the fracture site after perindopril treatment.
All data are given as mean ± s.d. *P<0.05 versus corresponding values of the vehicle-treated controls. # P<0.05 versus corresponding values of specimens at 2 weeks post-fracture (n = 6 per group).

