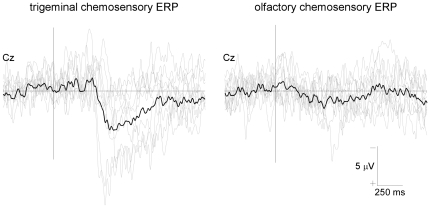
Figure 1. Trigeminal and olfactory chemosensory ERPs.
Trigeminal and olfactory chemosensory ERPs recorded at the scalp vertex (Cz vs. A1A2) in 11 healthy normosmic volunteers. Gaseous CO2 (50% v/v) was used to selectively activate trigeminal afferents. 2-Phenylethanol (50%v/v) was used to selectively activate olfactory afferents. 60 stimuli were presented, lasting 200 ms (20-ms rise-time), separated by a 30 s inter-stimulus interval. Individual ERP waveforms are shown in light grey, while the group-level average waveform is shown in black. Note that trigeminal chemosensory stimulation elicited a clear negative-positive complex (TRI-N1/TRI-P2), contrasting with the low signal-to-noise ratio of the response elicited by olfactory chemosensory stimulation, which was clearly identifiable in only a few subjects.

