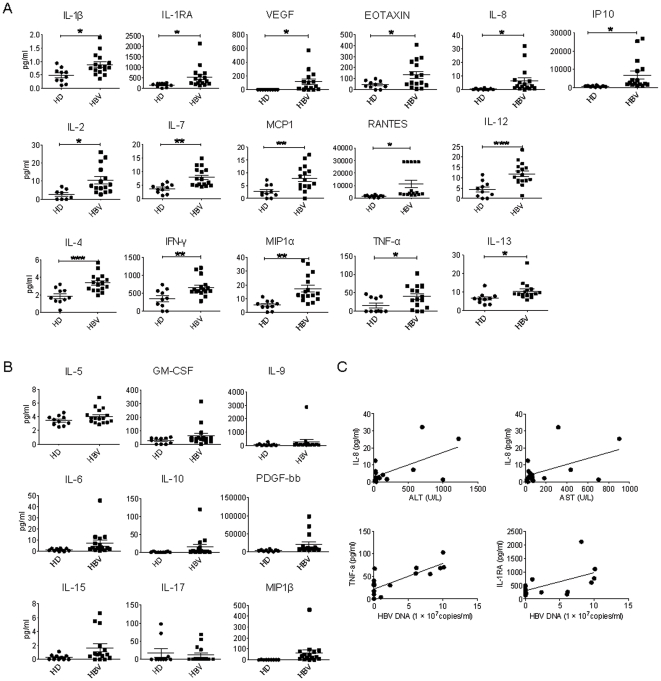
Figure 2. Plasma cytokine profiles of chronic HBV patients.
A and B. Luminex results show the expression levels of 25 cytokines in the plasma of healthy donors (HD) (n = 10) and chronic HBV patients (n = 16). The expression levels (pg/ml) of cytokines that displayed significant differences between healthy donors and HBV patients are shown in A, and the expression levels of cytokines that did not display significant differences are shown in B. * p<0.05; ** p<0.01; *** p<0.001. C. Correlation between IL-8 and ALT levels (p<0.05); IL-8 and AST levels (p<0.05); TNF-α and HBV DNA levels (p<0.001); and IL-1RA and HBV DNA levels (p<0.05) in chronic HBV patients.

