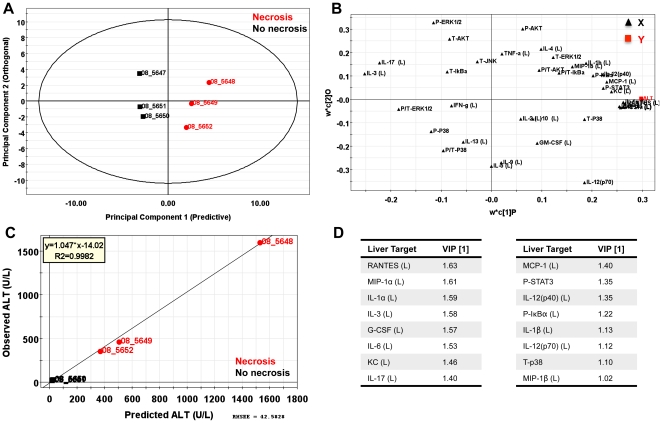
Figure 9. Liver-specific OPLS analysis of C. rodentium infected animals at 3 DPI.
OPLS analysis of C. rodentium infected animals at 3 DPI using serum cytokines and chemistries (X) for prediction of ALT levels (Y). (A) Mice segregated well in the predictive component (principal component 1) with an R2X (1) = 0.35, indicating this component captured ∼35% of the variance present in the X variables. (B) The predictive weight and covariation of serum targets (X variables, black triangles) in relation to serum ALT (Y, red square). (C) Observed vs predicted plot for ALT resulted in a R2 = 0.9892 indicating a highly predictive model based on hepatic cytokines. (D) Table representing the VIPs >1 for the predictive component for serum ALT.

