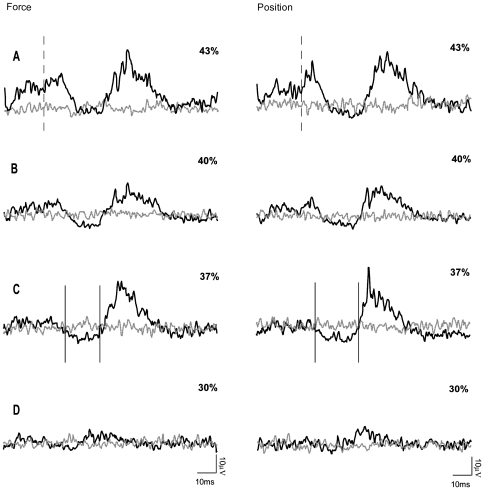
Figure 4. Development of EMG supression.
Every trace is the average of 80 sweeps of the rectified FDI EMG. Traces are superimposed, the black line represents the average of sweeps with stimulation whereas the grey line represents the average EMG activity without stimulation. The sweeps shown with and without transcranial magnetic stimulation were randomly assessed. In this example of a single subject, four different stimulus intensities were used and are expressed as percentage of maximum stimulator output: A 43%; B 40%; C 37% and D 30%. The vertical dashed lines in A represent the onset of the facilitation and the vertical lines in C show the onset and end of the suppression. This time window was used in order to quantify the suppression. The left EMG traces represent the force-controlled contraction and the right panel the position-controlled contraction.

