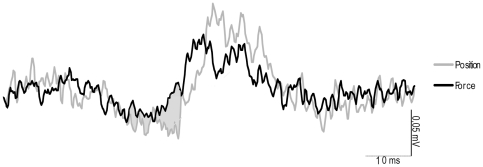
Figure 5. EMG suppression in one representative subject.
Ensemble averaged FDI EMG taken from a single subject during the stimulated condition. The grey shaded area between the two traces indicates the differences in TMS-evoked suppression between the two tasks. The onset of the EMG suppression was similar but the extend was significantly greater in the position-controlled task.

