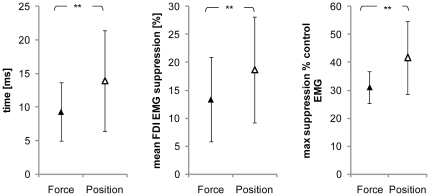
Figure 6. Group mean data of EMG suppression.
Grand mean values (+SD) of the maximal EMG suppression in the force (▴) and the position-controlled task (▵). The maximum was greater in the position-controlled task compared to the force-controlled task (**P = 0.028) (A). Additionally, the duration of FDI EMG suppression caused by subTMS lasted significantly longer than in the force-controlled task (**P = 0.024) (B). Finally, the mean suppression of FDI EMG as percent of the control EMG. The FDI EMG suppression was significantly greater for the position-controlled task than for the force-controlled task (**P = 0.025) (C).

