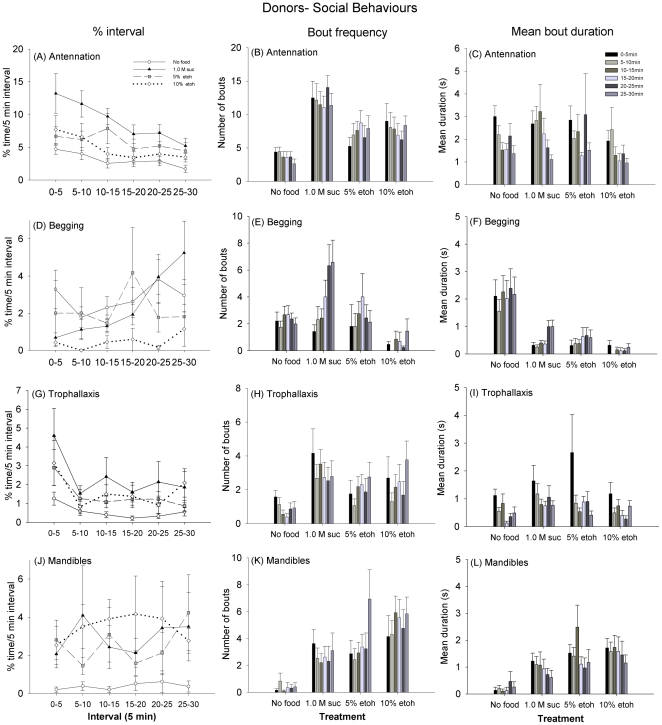
Figure 3. Hunger and inebriation state influence social behaviour.
The time spent engaged in the each behaviour, the mean bout frequency, and the mean bout duration are shown for each 5 min interval. (A–C) Antennation was greatest at the start of the observation, and gradually decreased. The donors fed 1.0 M sucrose spent more time antennating and had longer bouts of antennation than bees in any of the other treatment groups; the hungry bees spent the least time antennating, and had the shortest bouts of antennation (P<0.001 for all comparisons). (D–F) Begging behaviour (proboscis out) generally increased at later intervals for all treatments; the 10% ethanol-fed bees spent the least time begging. The hungry donors exhibited the longest bouts of begging. (G–I) Hungry bees were the least likely to spend time performing trophallaxis. They also had the least frequent and shortest bouts of trophallaxis. The ethanol treatments were not less likely than the sucrose fed bees to perform bouts of trophallaxis, nor were their bouts shorter (all comparisons, P>0.050). (J–L) The hungry bees were also least likely to exhibit mandible opening, but the other treatments did not differ in time spent performing mandible opening (all comparisons, P>0.050). Bout frequency and bout duration of mandible opening was greatest for the ethanol-fed donors (P<0.010). NHungry = 19, N1.0 M Suc = 19, N5% etoh = 16, and N10% etoh = 13. ± SEM Note: Y-axis scale is not the same on all graphs.

