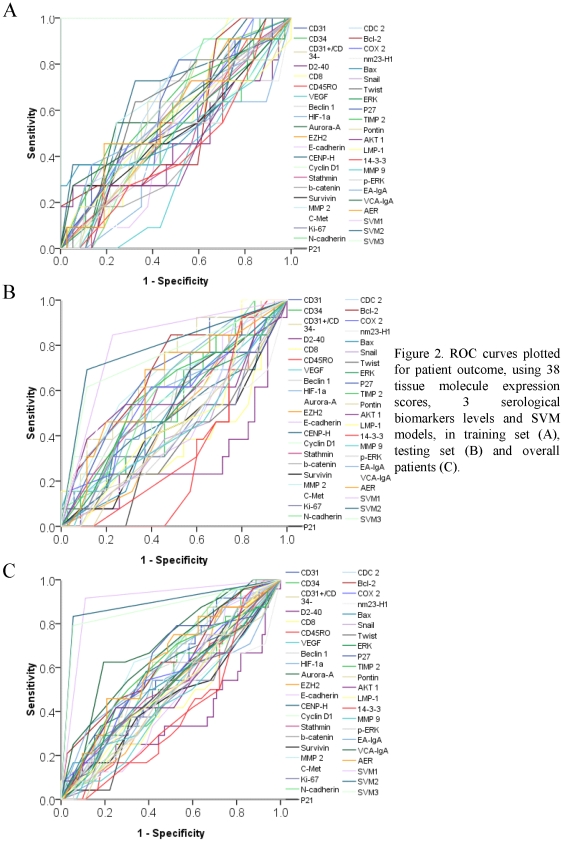
Figure 2. ROC curves plotted for patient outcome, using 38 tissue molecule expression scores, 3 serological biomarkers levels and SVM models, in training set (A), testing set (B) and overall patients (C).
In training set (A), at each immunohistochemical staining score of 38 tissue molecules and 3 serological biomarkers, the sensitivity and specificity for the outcome being studied were plotted, thus generating a ROC curve. The score, that closest to the point with both maximum sensitivity and specificity (0.0, 1.0), was selected as the cutoff point for further analysis.

