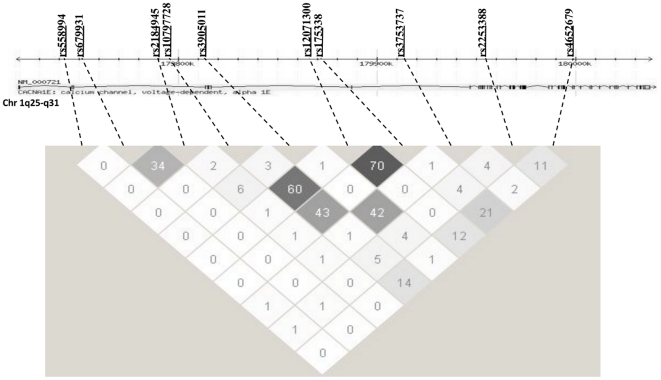
Figure 1. Gene structure, location of polymorphic sites, and pairwise LD among SNPs in CACNA1E.
The upper portion of the figure shows the gene structure and location of the polymorphisms genotyped in the VNDS population. The lower portion of the figure shows a schematic of the pairwise LD, calculated as r 2, among the SNPs in the VNDS patients. The dotted lines connect each SNP name and position with the corresponding cell in the LD matrix. Increasing level of LD is shown by darker grayscale.

