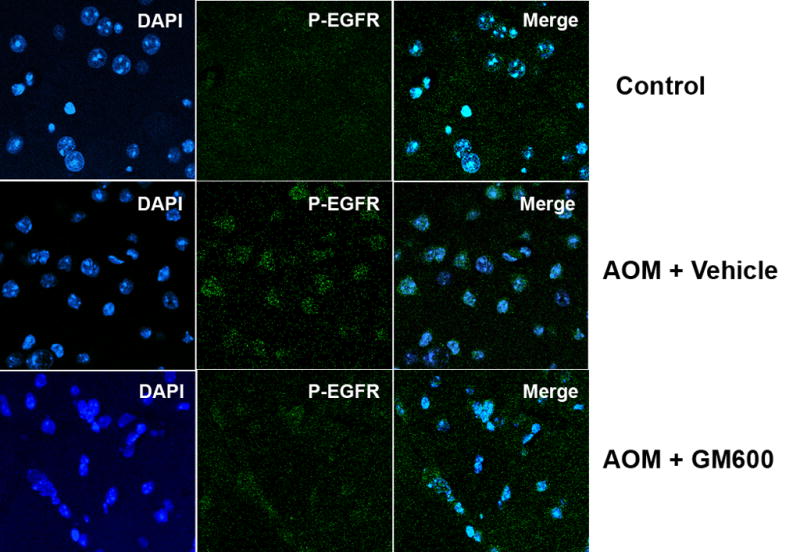
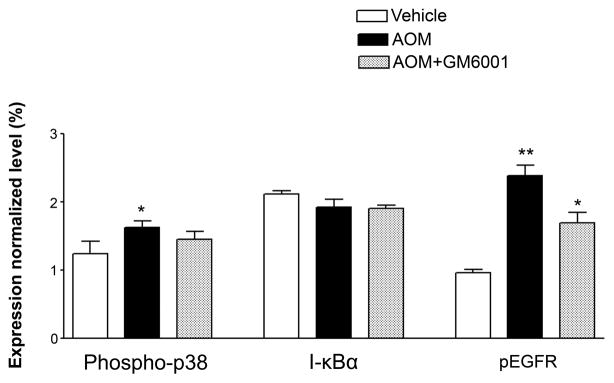
Figure 3.


EGFR activation and p38 MAPK/NFκB activation in brains of ALF mice. (A) Western blot of brain samples from control mice, and AOM-induced ALF mice treated with vehicle or with GM6001 (MMP-9 inhibitor). (B) Densitometric quantification of p38 MAPK, IκBα, and p-TyrEGFR expression in brains of control mice and ALF mice treated with and without GM6001. Values are expressed as mean ± SEM with t-test. (N=3,*P<0.05). (C) Confocal microscopic evaluation of brains of control versus ALF mice treated with vehicle or GM6001. Activated EGFR is seen as green and nucleus as blue. (Hepatology 53:1294, 2011).

