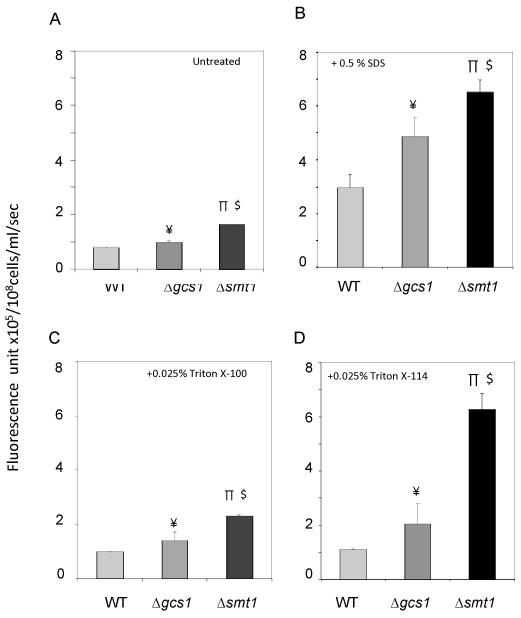
Figure 6. Sytox green (SG) uptake assays.
Untreated (A), 0.5% SDS-(B), 0.025% Triton X-100- (C) 0.025% Tritox X-114 treated (D) cells (density 108 cells/ml) were incubated in PBS and 2 μM SG in the dark for 10 min and then fluorescence (arbitrary unit) was quantified. Background corrections were made by subtracting the fluorescence in PBS (−/+ detergents) + SG for untreated and treated cells, respectively. Both Δsmt1 and Δgcs1 cells had greater Sytox green uptake than WT, whether or not cells were untreated or treated with detergents. The difference in fluorescence was most prominent at pH 7.2, 37 °C, 5% CO2, conditions (shown in the figure) which replicate the alveolar lung environment. All results were means ± SD of three independent experiments. ¥P<0.05, Δgcs1 versus WT; πP<0.05, Δsmt1 versus WT; $P<0.05, Δsmt1 versus Δgcs1;

