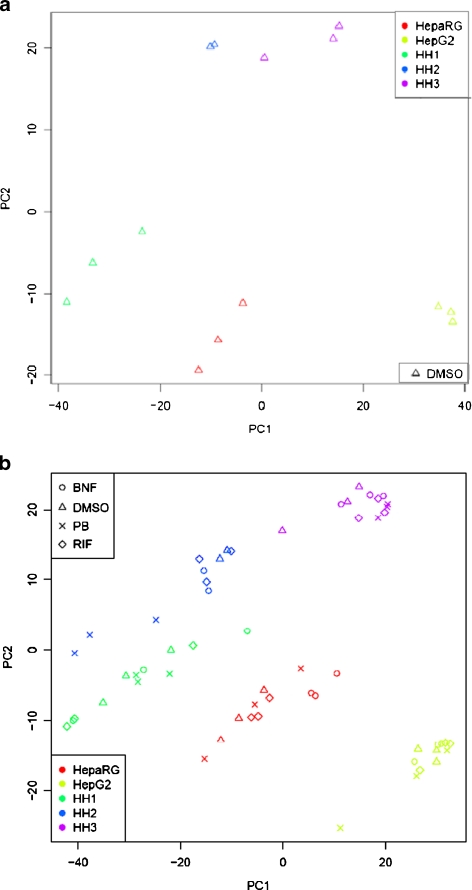
Fig. 1.
Principal component analysis of gene expression data from HepG2, HepaRG, and human hepatocytes exposed to solvent and three inducers. PCA was performed on the normalized intensities of the control samples (cells exposed to 0.1% DMSO) (a) and of cells exposed to BNF, PB, and RIF (b). Each model has been done in triplicate and each point in the PCA plot represents the gene expression result of a separate array. One of the triplicates of donor 2 (HH2) was an outlier due to technical issue and for that reason not taken into account to make any further calculations

