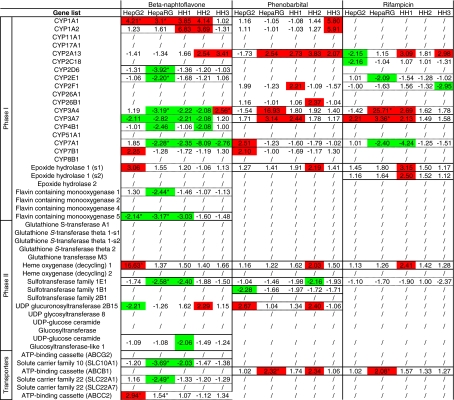
Table 4.
Summary of the gene expression fold changes in the different cellular models after exposure
The numerical value indicates the fold changes for each cellular model after induction compared with the control condition; differentially expressed genes that are upregulated by at least a factor of 2 or downregulated by at least a factor of −2 are colored in red or green, respectively. A dash (/) is indicated in the table when there is no fold change in gene expression by at least a factor of 2 or −2 in any of the cellular models. When at least one cellular model has a fold change higher than 2 or lower than −2, the gene expression data are reported for all the models. A full rectangle is drawn when all cellular models are consistently regulated in the same direction (five of five); a dashed rectangle is drawn when only four out of five cellular models are regulated in the same direction

