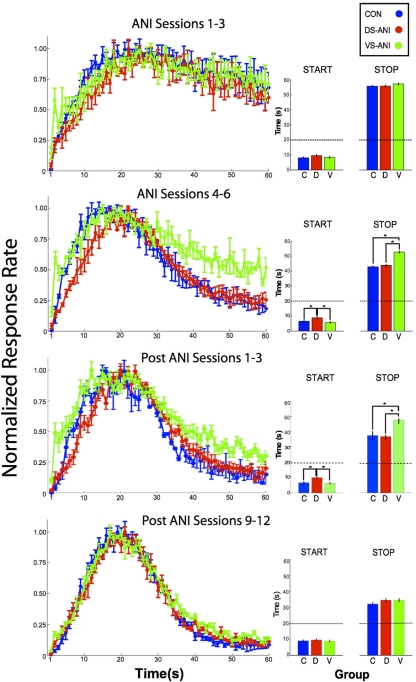
Figure 2.
Normalized mean (± SEM) peak functions (left column) for CON (blue), DS-ANI (red) and VS-ANI (green) treatment groups during four phases of the experiment: (A) ANI Sessions 1–3, (B) ANI Sessions 4–6, (C) post-ANI Sessions 1–3, and (D) post-ANI Sessions 12–14. Insets (right column) are included for each peak function to describe the “Start” and “Stop” times obtained from the signal-trials analysis conducted on the data obtained from that phase. Asterisks denote a significant difference between the treatment groups compared, which are bracketed by dark lines. ANI = anisomycin; CON = control; DS = dorsal striatum; VS = ventral striatum.

