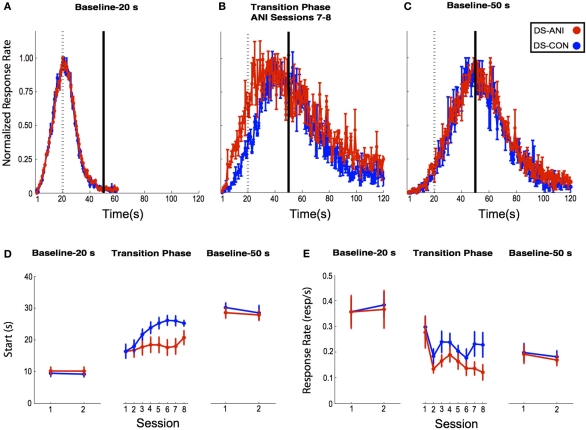
Figure 4.
(A) Baseline 20 s peak-interval (PI) functions for rats in the DS-CON (blue) and DS-ANI (red) treatment groups as a function of the last two sessions of 20 s PI training prior to the transition to 50 s PI training. (B) Peak functions for each treatment group during Sessions 7–8 following the transition from 20 s PI → 50 s PI training. (C) Baseline 50 s PI functions for both treatment groups averaged across two sessions three weeks after the ANI treatment ended. (D) “Start” times (s) for responding during the three specified phases of PI training for DS-CON and DS-ANI treatment groups. The Baseline 20 s PI and Baseline 50 s PI “Start” times during each session correspond to the peak functions displayed in Figures 2A,C. During the transition phase, individual data were smoothed across 10 sessions of microinjections using a running median with a 3-session window. (E) Mean (± SEM) response rate (responses/s) on probe trials during the three specified phases of the experiment for the DS-CON and DS-ANI groups. ANI = anisomycin; CON = control; DS = dorsal striatum.

