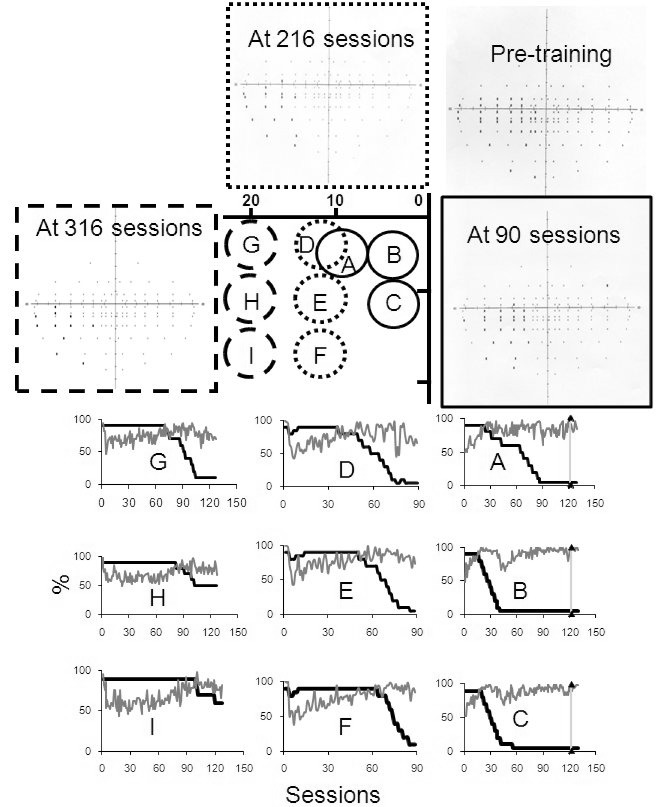
Figure 4.
At the centre of the figure a schematic representation of stimulus locations used during training is depicted. Initially the patterns were shown at locations A-C. The detection performance (grey lines) and target contrasts (dark lines) for each training session are also plotted. Detection performance improves with time and remains high even when the stimulus contrast is reduced. When all pattern contrasts reached 5% the block of testing terminated and the suprathreshold visual fields were obtained. The patterns were then moved leftward during subsequent blocks of training and the pattern contrasts were reset to 90%. Plots D-F and G-H represent the detection task performance in the second and third blocks of training.

