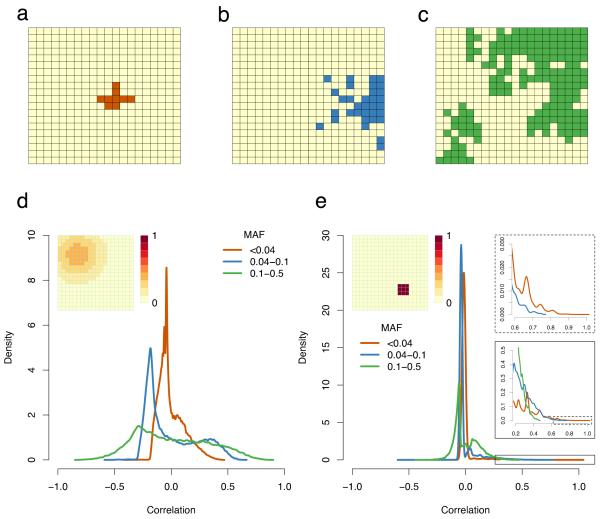
Figure 2. Spatial distribution of rare and common variants.
(a-c) Examples from simulations of the spatial distribution of (a) rare, (b) low frequency and (c) common variants. In each case, grid squares where the allele is present are in colour; (d-e) The distribution of the correlation coefficient between genotypes and non-genetic risk for rare, low frequency and common variants. These are kernel density estimates of the distribution of the correlation between genotypic value (0/1) and associated environmental risk for individuals from the simulations described in Figure 1; (d) Gaussian risk; (e) Small, sharply defined risk. The inset panels in e show successive enlargements of the boxed areas in the tail of the distribution. All parameters are the same as in Figure 1. Abbreviations: MAF: minor allele frequency.

