
Figure 1.
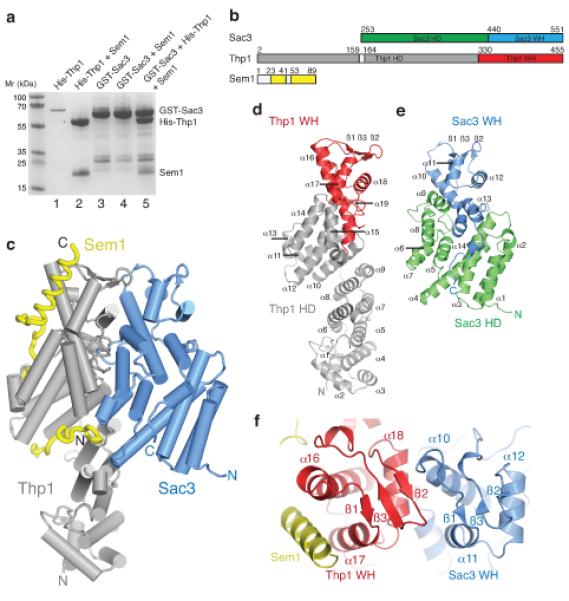
The structure of the Sac3–Thp1–Sem1 complex (a) SDS PAGE of pull-down assays used to monitor the assembly of the Sac3–Thp1–Sem1 complex. His-Thp1 is insoluble (lane 1 – the band at ~70kD is an impurity) unless coexpressed with Sem1 (lane 2), whereas GST-Sac3 is soluble when expressed alone (lane 3) and does not bind Sem1 upon coexpression (lane 4). The Sac3–Thp1–Sem1 complex is formed when GST-Sac3 and Thp1–Sem1 lysates are mixed (lane 5). Lanes 1-2 are His-tag pull-downs and lanes 3-5 are GST-pull-downs. (b) Domain organization in the Sac3–Thp1–Sem1 complex. (c) Overview of the Sac3–Thp1–Sem1 complex with α-helices represented as cylinders and Sem1 in worm format. (d,e) Ribbon views of Thp1 and Sac3, highlighting the secondary structural elements of the superhelical domains (HD, gray, green) and the winged helix domains (WH, red, blue). (f) Sac3–Thp1–Sem1 complex rotated ~90° about the horizontal compared with (c) highlighting the Sac3 and Thp1 winged helix domains.