
Figure 2.
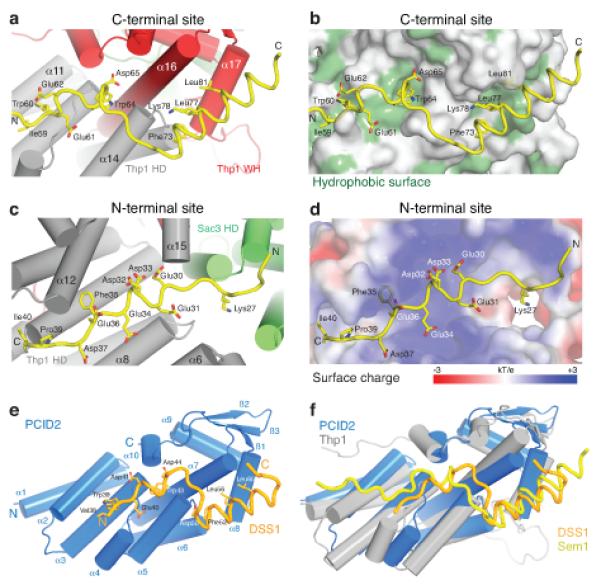
Structural basis for the Thp1–Sem1 interaction. (a,b) Interface between Thp1 and the C-terminal Sem1 binding region with (a) important Sem1 (yellow) sidechains shown as sticks and (b) hydrophobic Thp1 residues highlighted in green. (c,d) Corresponding views of the interface between the Sem1 N-terminal region (yellow) and Thp1 with (c) important sidechains shown as sticks and (d) the electrostatic surface potential of the N-terminal Sem1 binding site on Thp1. (e) PCID2 (residues 205-399, blue) and DSS1 (residues 38-67, orange) complex with the α-helices as cylinders and DSS1 in worm format. DSS1 sidechains that make key interactions within the interface are shown as sticks. (f) Structural alignment of the PCID2–DSS1 complex with the corresponding residues of Thp1 (grey) and Sem1 (yellow) from the Sac3–Thp1–Sem1 complex.