Figure 2.
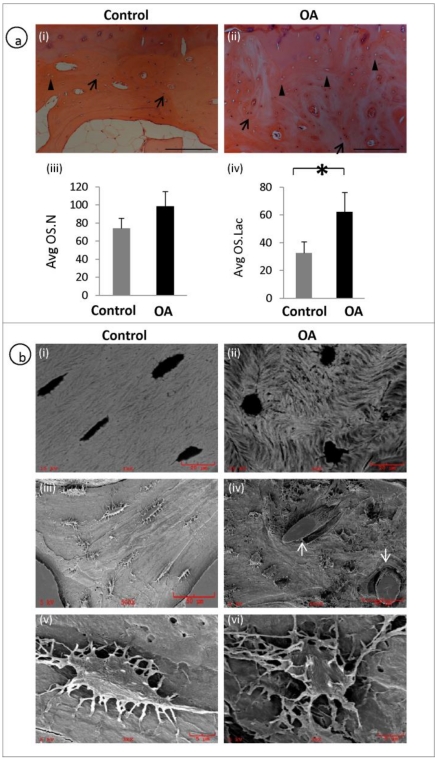
Disrupted osteocyte morphology and distribution in OA patients: H&E staining of the subchondral bone of OA and patient matched control showing the histological appearance of osteocyte morphology, number and distribution. Arrows represent osteocyte nucleus and arrow heads represent osteocyte lacunae (a, i-ii). OA subchondral plate showed no significant increase in the Avg OS.N (P= 0.0691) compared to control (a, iii). OA subchondral plate showed a significant increase in the Avg OS.Lac (P= 0.0041) compared to control (a, iv). Bars equal mean±SD, n=5, *p≤0.05.(b, i-ii) Back scatter image and (b, iii-vi) SEM images show clear morphological differences which include rough lysed and rounded appearance with fewer dendrites in OA osteocytes and blood vessel (arrows) invasion in OA samples (b, iv).

