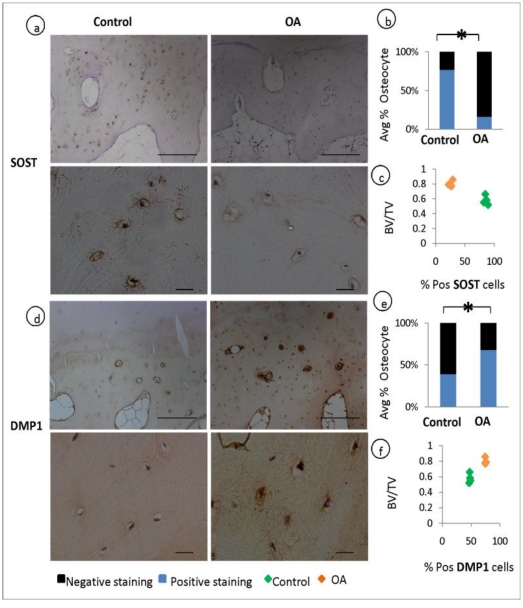
Figure 3.
Expression of osteocyte markers and the correlation to BV/TV: Immunohistochemical analysis shows a decrease in the average % positive stained osteocytes for SOST in OA patients compared to controls (P=0.001) (a-b). and an increase in the average % positive stained osteocytes for DMP1 in OA patients compared to controls (P=0.003) (d-e) Correlation studies reveals that the expression of SOST decreases with the increase in bone volume to total volume (BV/TV) (c) and the expression of DMP1 increases with increase in BV/TV f).

