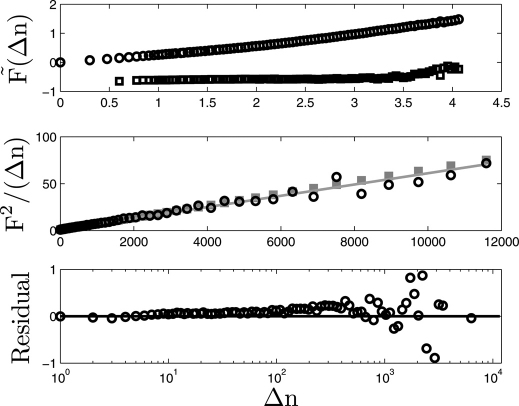
Figure 3. Fluctuation plots for λ-DNA.
Following Ref.12 the FA (dots) and DFA (squares) fluctuation plots are shown, normalized here by (Δn)0.5 (top panel). Note the concave up curvature of the FA results, and the approximately flat DFA results. Karlin & Brendel model predictions (here recast into linear form,  ) for λ-DNA (middle, lower panels) are close to the observed FA measured fluctuations (dots). A linear fit (grey line) indicates the Karlin & Brendal model is suitable; for two patch types an analytic prediction of fluctuations (grey squares) captures the observed λ-DNA fluctuations (black dots) surprisingly well, where the patch biases required for prediction are empirically estimated from the sequence. Some short-range structure, visible when inspecting the residual between the model and the data (bottom panel), is not accounted for by the two-type patch model, and is attributable to a notable short-range correlation in the DNA sequence, where base-pairs which are separated by two others are (positively) correlated.

