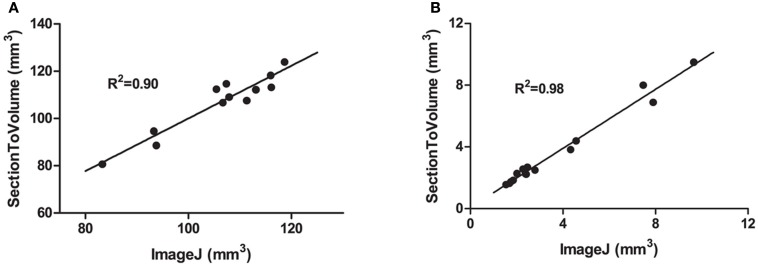
Figure 2.
Comparisons between measurements made in ImageJ and SectionToVolume. (A) The hemispheric tissue volume between bregma 0 and bregma −4.5 after focal TBI in the mouse. (B) The volume of the ventricles of both sham- and brain-injured animals in addition to values of the cortical cavity of brain-injured animals. For all measurements, values obtained with the SectionToVolume were highly correlated with ImageJ data.

