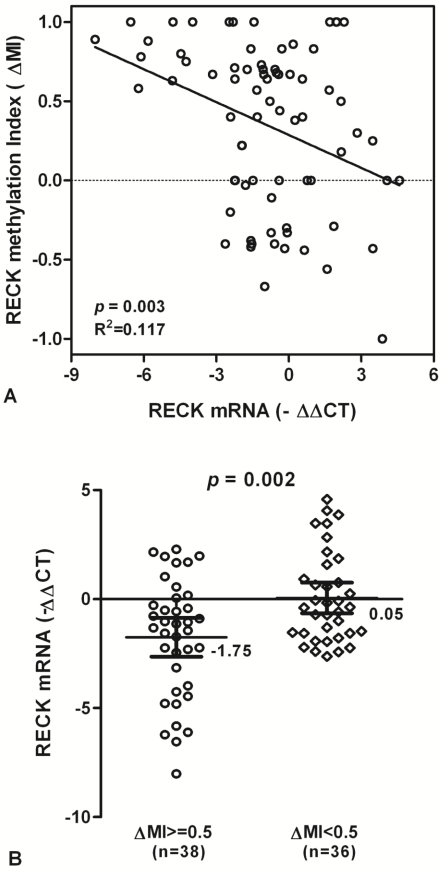
Fig 4.
RECK mRNA and promoter methylation in HCC patients. (A) The scatter plots summarized relative expression levels of RECK mRNA (-∆∆CT) associated with relative methylation index (∆MI) in HCC patients. (B) RECK mRNA expression were lower in HCC patients with ∆MI>= 0.5 than those with ∆MI<0.5. Statistical analyses were done using the unpaired t test. Statistical analyses were done using Pearson correlation test. -∆∆CT, - (∆CTHCC-∆CTNon-Hcc); ∆MI, MIHCC-MINon-Hcc.

