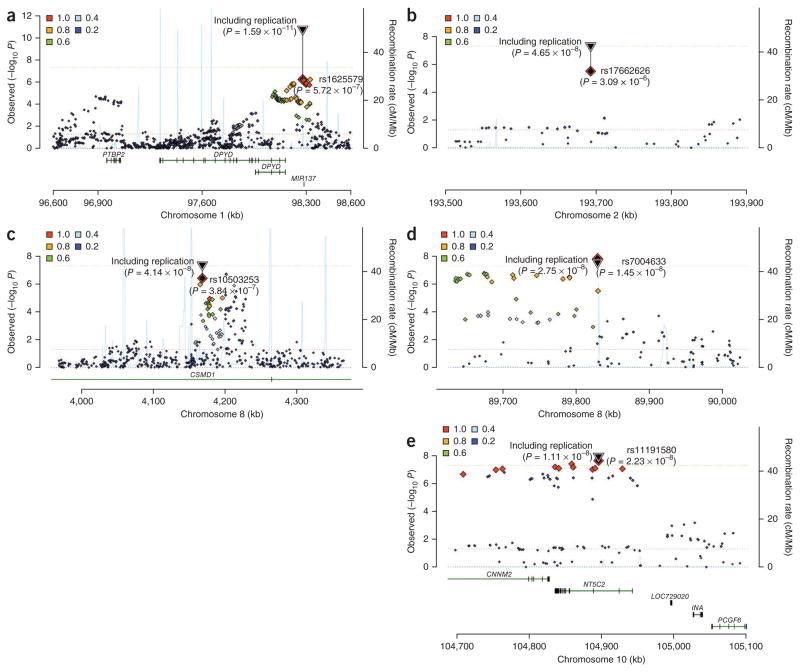
Figure 2.
Regional association plots for five new schizophrenia loci. Regional P value plots for each of the five new schizophrenia loci: 1p21.3, 2q32.3, 8p23.2, 8q21.3 and 10q24.32-q24.33. Each plot shows the most associated SNP (key SNP) and its genomic region from the first column of Table 2: stage 1 scan results for each SNP ± 200 kb to the key SNP are shown. On the x axis is the genomic position, and on the y axis is −log10 P. Larger SNP symbols indicate higher LD (based on HapMap 3 data) to the key SNP than smaller SNP symbols. Color coding (from red to blue) denotes LD information; see also the legend within the plot.

