
Figure 1.
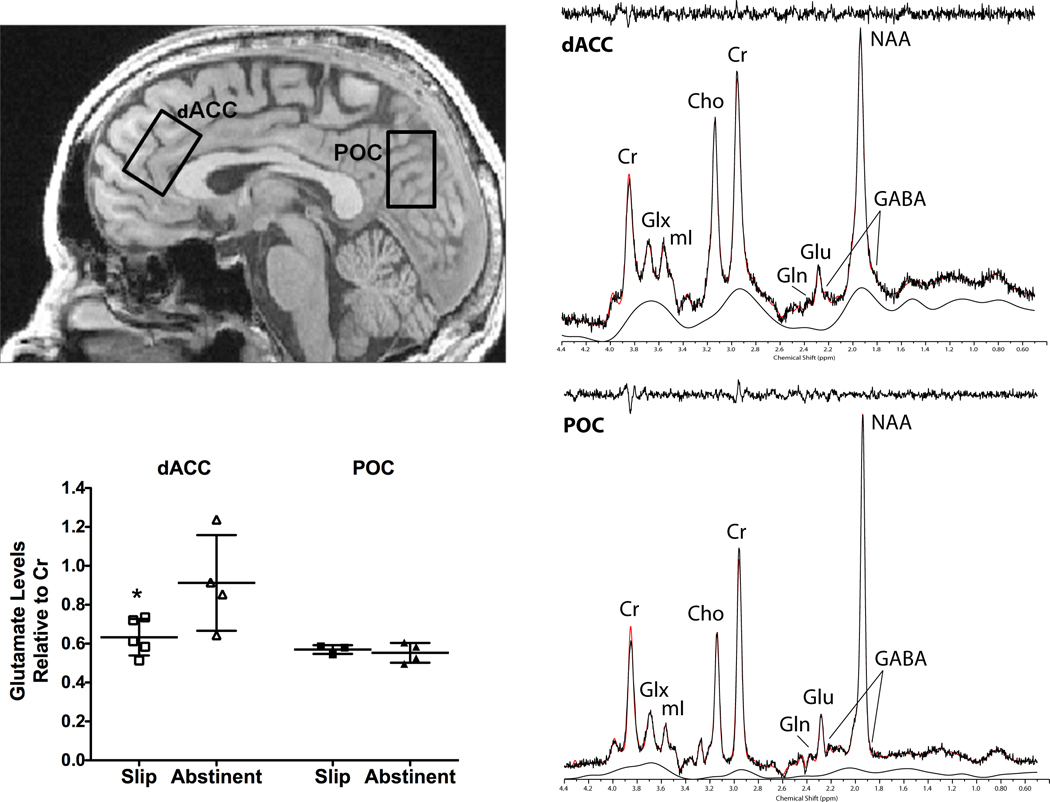
Sagittal (top, left panel) view of a representative T1-weighted image illustrating voxel placements in the dorsal anterior cingulate cortex (dACC) and parieto-occipital cortex (POC). The J=0.0Hz spectral extraction is shown for dACC (top, right panel) and POC (bottom, right panel) voxels. Both spectra are displayed with no filtering and LCModel fit with residual. Note: our results for metabolite measures are based on the LCModel serial fitting method, as described by Jensen and colleagues (2009), which fits all 64 J-resolved spectra over a bandwidth of 50Hz in f1. Highly coupled metabolites such as glutamine (Gln) and gamma-aminobutyric acid (GABA) are not readily apparent in the J=0.0Hz spectrum due to either suppression or overlap by dominant resonances such as creatine (Cr) and N-acetylaspartate (NAA). Nonetheless, we label the remnant peaks of Gln and GABA that are partially visible in the J=0.0Hz spectrum for clarity and completion. Glutamate (Glu)/Cr ratios in the dACC and POC voxels in slip and abstinent groups are also shown (bottom, left panel). Values are the means ± SD. * p<0.03 relative to abstinent group dACC Glu/Cr ratios.
Cho, choline; Glx, combined Glu-Gln; mI, myo-inositol.