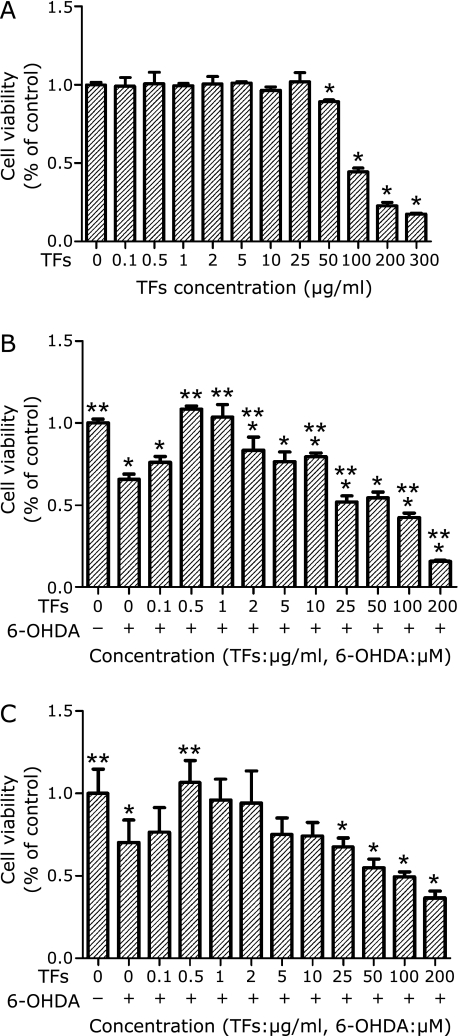
Fig. 2.
Effects of 6-OHDA and TFs on SH-SY5Y cell viability. (A) Cells were incubated in medium containing different concentrations of TFs for 24 h. The cell viability was determined by MTT assay. (B) Cells were pre-incubated with different concentrations of TFs for 3 h, then treated with 100 µM 6-OHDA for an additional 24 h and the cell viability was measured by MTT assay. (C) Cells were pre-incubated with different concentrations of TFs for 3 h, then treated with 100 µM 6-OHDA for an additional 24 h and the cell viability was measured by SRB assay. Data are expressed as percentage of the untreated control means ± SD, n = 7. *p<0.01 significantly different from untreated control cells and **p<0.01 significantly different from 6-OHDA group.

