Figure 4.

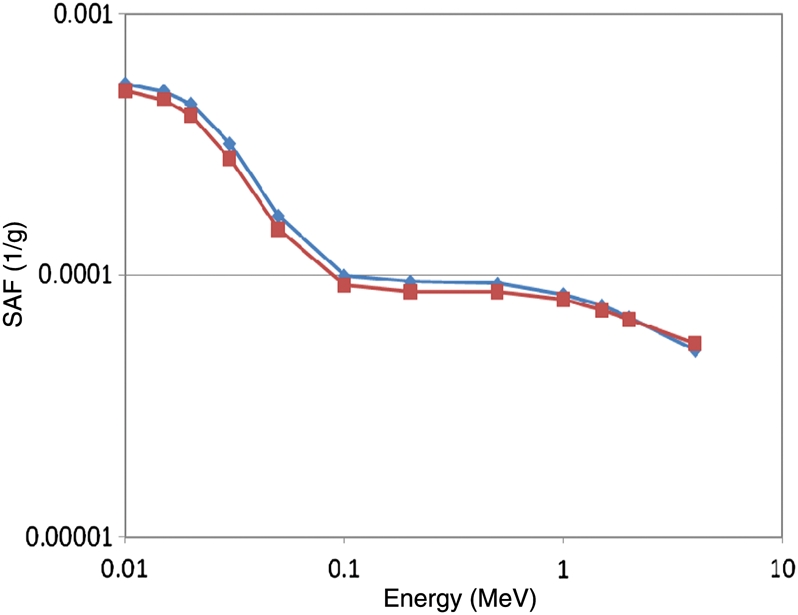
Sample photon SAF plot, showing comparison of NURBS model values (diamonds) with values from the Cristy/Eckerman stylised series (squares): Adult male (liver←liver).

Sample photon SAF plot, showing comparison of NURBS model values (diamonds) with values from the Cristy/Eckerman stylised series (squares): Adult male (liver←liver).