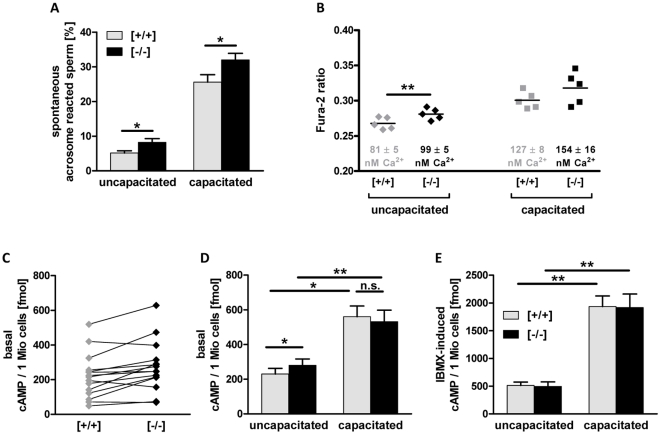
Figure 11. Tas1r1 deletion results in increased spontaneous acrosome reaction and elevated cytosolic Ca2+ and cAMP levels.
[A] Incidence of spontaneous loss of the acrosomal vesicle in sperm from Tas1r1 knock-out mice compared to control wild-type sperm. To quantify spontaneous acrosome reaction of uncapacitated and fully capacitated sperm, epididymal spermatozoa of wild-type and Tas1r1 null mutant mice with identical genetic background were either directly assessed for acrosomal secretion rates or incubated for 90 min in capacitation medium (HS/BSA/NaHCO3). Data shown are mean values ± SEM of 15 independent experiments of different mouse sperm preparations. Obtained data were subjected to a Student's t-test for determination of significant differences (*: p≤0.05) between pairs of both genotypes. [B] Comparison of [Ca2+]i, of wild-type and Tas1r1-deficient spermatozoa. To determine basal [Ca2+]i in the head region of wild-type ([+/+], grey rhombs and squares) and Tas1r1-deficient ([−/−], black rhombs and squares) spermatozoa, epididymal sperm cells were either directly loaded with Fura-2AM ([uncapacitated], rhombs on the left side), or capacitated for 60 min prior Fura-2 loading ([capacitated], squares on the right side). Subsequently, Fura-2 fluorescence at 510 nm was measured at excitation wavelengths of 340 and 380 nm using a microscope based imaging system (TillPhotonics, Graefelfing, Germany). Fura-2 ratios (F340/F380) were determined for at least 14 cells per sperm preparation (total number of measured sperm cells: uncapacitated: 151 [+/+], 136 [−/−]); capacitated sperm: 168 [+/+], 181 [−/−]). [Ca2+]i was calculated using the mean Fura-2 ratio of each animal (F340/F380) according to [84]. Only spermatozoa that showed [Ca2+]i, increases upon stimulation with the calcium ionophore ionomycin were considered. Shown are vertical scatter plots of Fura-2 ratios of isolated spermatozoa of 5 animals for each genotype (littermates and animals with matched genetic background); the mean Fura-2 ratio is indicated by a bar. Mean values ± SEM of calculated [Ca2+]i, for each genotype are given in numbers in the lower part of the graph.Statistical analyses were done using a paired Student's t-test (**: p<0.01). [C] Vertical scatter plot of basal cAMP concentration in uncapacitated spermatozoa. Shown are basal cAMP concentrations of epididymal sperm isolated in HS buffer. Littermate animals and animals with identical genetic background were prepared and assayed in parallel. cAMP values of corresponding animal pairs are connected by a line. Note that in 13 of 15 analyzed animal pairs, cAMP concentrations were higher in Tas1r1 -deficient [−/−] mice than in wild-type [+/+] animals. [D–E] cAMP concentrations in Tas1r1-deficient sperm compared to sperm of wild-type animals. Epididymal sperm of wild-type [+/+] and Tas1r1-deficient [−/−] mice were either isolated in HS (for 15 min) [uncapacitated] or in capacitation buffer (HS/BSA/NaHCO3 for 60 min; [capacitated]), and subsequently treated for 5 min at 37°C with buffer alone [D] (uncapacitated: n = 15; capacitated: n = 11) or with 0.5 mM IMBX [E] (uncapacitated: n = 13; capacitated: n = 9). After shock-freezing the cells in liquid nitrogen, cAMP was extracted with PCA (7%), and quantified using a commercially available EIA kit. Data are mean values ± SEM. Sperm of littermate animals and animals with identical genetic background and age were assayed in parallel and compared using a paired student's T-Test (*: p≤0.05; **: p<0.01).

