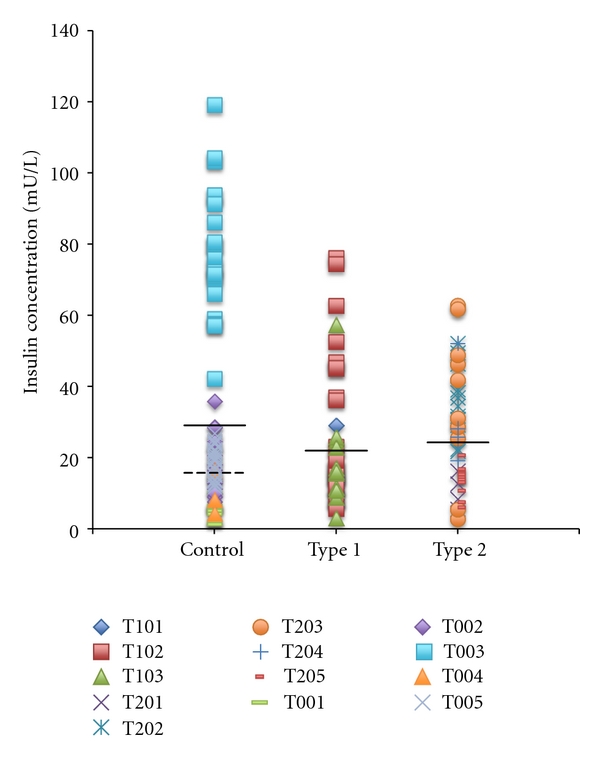
Figure 2.

Total Insulin content of each milk sample (fore and hind milk) collected for all mothers as measured by the CMIA method. Dark lines indicate the mean for each group. The dotted line indicates the mean for the control group with the outlier mother T0-03 removed.
