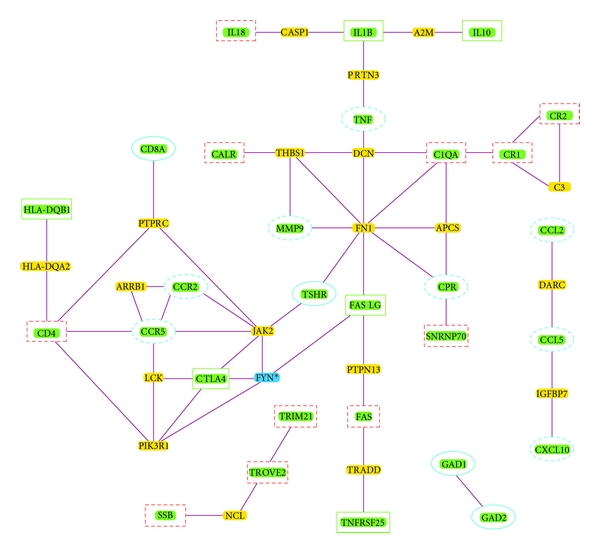
Figure 3.

Network analysis of the genes that contribute to the clusters of autoimmune diseases. Solid squares: genes with a contribution higher than 0.1% that are shared by more than one cluster. Dotted squares: genes with a contribution higher than 0.1% from the SLE-SS cluster. Solid ovales: genes with a contribution higher than 0.1% from the T1D-AITD cluster. Dotted ovales: genes with a contribution higher than 0.1% from the RA-MS cluster. The other nodes correspond to significant intermediary ones (the asterisk indicates a nonsignificant intermediary node).
