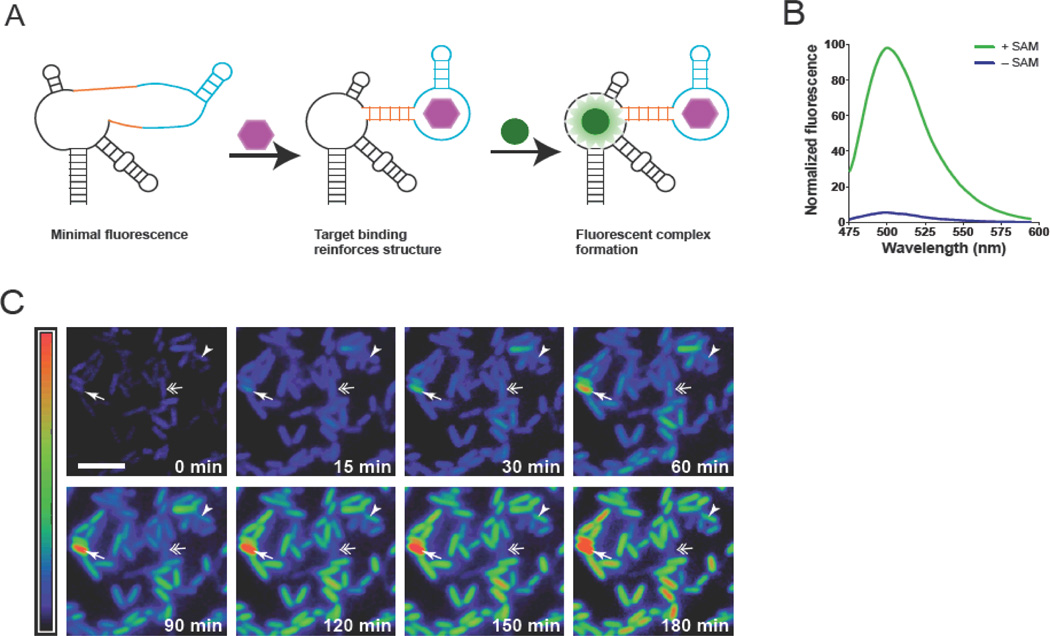
Fig. 1. Imaging S-adenosylmethionine in living cells using RNA.
(A) The sensor comprises Spinach (black), a transducer (orange), and target-binding aptamer (blue). Target binding to the aptamer promotes stabilization of the transducer stem, enabling Spinach to fold and activate DFHBI fluorescence. (B) Emission spectra of the SAM sensor in the presence or absence of SAM. (C) Distinct patterns of SAM accumulation after adding methionine to E. coli expressing the SAM sensor RNA. Some cells exhibited higher than average (arrow) or slow increases (arrowhead) in SAM (arrowhead). A cell that first increases and then decreases its SAM levels is indicated by a double arrow. Images are pseudocolored to show the fold increase in fluorescence at each time point relative to 0 min (0-11.2-fold). Scale bar, 5 µm.

