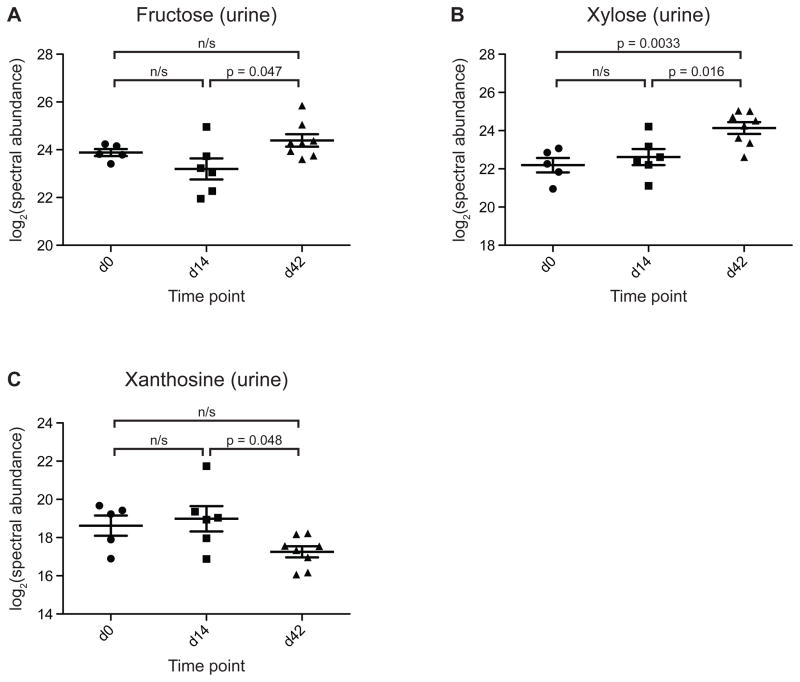
Figure 6. Select urinary metabolites whose levels are altered after the introduction of the FMP strain consortium into mice harboring a defined model human gut microbiota.
The statistical significance in pairwise comparisons shown in panels A-C was evaluated using a two-tailed Student’s t-test on the log-transformed spectral abundance of the metabolite in each sample. Values for the statistical significance of differences between time points as evaluated by one-way ANOVA, followed by FDR-correction and a post-hoc Tukey HSD test are also provided in Table S12. Horizontal bars represent group means, vertical bars represent ± SEM. n/s; not significant.

