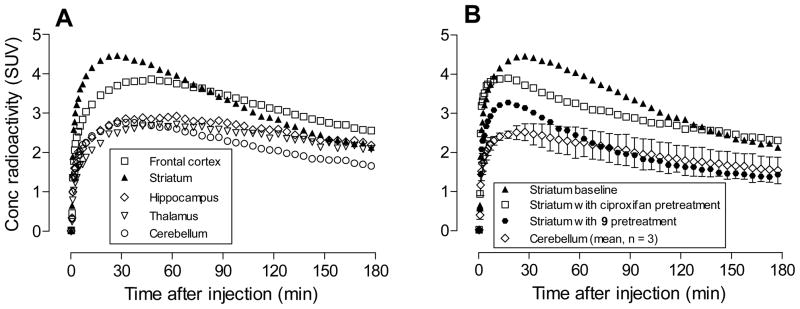
Figure 2.
Brain region time-activity curves after [18F]9 was injected intravenously into monkey at baseline (Panel A). Panel B shows the effect of pretreatment with either ciproxifan (2.0 mg/kg, i.v.) or 9 (1 mg/kg, i.v.) on the time-activity curve for striatum. The mean curve for cerebellum from the three experiments is shown for comparison. Error bars represent mean ± SD.

